Tag: analysis

  • Cost of gas vs electricity in South Africa

    Introduction

    I have been investing in a solar system at home, since South African load shedding is really getting me down. One of the key elements of going off the grid is to reduce your electricity consumption. I’ve focused on reducing demand by scaling down our geysers from 3 to 1 big one and 1 small undercounter unit. I also managed to find a second hand heat pump, so that geyser is going to be mainly heated using the heat pump.
    Whenever I have mentioned my plans to tradespeople, I have uniformly been met with suggestions to move to gas. In South Africa, that means LPG. I wanted to do a comprehensive check on costs, so here is the result of that analysis.
    You can find the Python scripts and Jupyter notebooks I used in the analysis here.

    Gas

    Prices

    LPG prices are published by SAPIA. They have separate pages for the current prices and historical prices. Note, if you’re following along, that they appear to have swapped the coastal prices and the Gauteng prices on 2016-08-03 and 2017-08-02, which I have corrected. I have also assumed that the prices quoted here are pre-VAT and have added 15 % to the quoted prices for the sake of comparison. There is a difference around R2/kg between the coastal and Gauteng prices, which has been moving up by a few cents every year since 2017. I have also included an 8 % per year increase on the values since 2015 for reference.
     

    Gas heating value

    The main thing you do with gas is to heat things. It is therefore useful to know the gas price not based on the mass (kg) but rather on the ability of the gas to heat things. This requires a quick diversion into “heating values” for fuels. When you burn a fuel, it decomposes into simpler components (gases), which are hot. You can transfer the energy from this hot gas to some cold substance like water or a pot. For LPG one of the gases that forms during combustion is water. Of course, at the temperatures of the flame, the water will be in gaseous form. But if the thing you are trying to heat is cold enough, the water will condense and impart an additional amount of heat on the object. In broad strokes, there are therefore two amounts of energy you can impart on a cold object by burning an amount of gas. One, called the Higher Heating Value (HHV) assumes that you can condense the water. If you can’t condense the water, you get the Lower Heating Value (LHV). 
    Here are the numbers I’ve used to figure out the heat you can extract from a kg of LPG:
    Component Fraction LHV HHV
    MJ/kg MJ/kg
    Propane 0.6 46.35 50.35
    Butane 0.4 45.75 49.50
    Total(LPG) 46.11 50.01
    Lastly, we factor in that 1 kWh = 3.6 MJ. For the HHV this works out to 13.9 kWh/kg of LPG. I will be using this factor for the later comparison as it presents the absolute best case of extracting heat to gas via combustion.

    Electricity prices

    For electricity prices, I have used the historical rates published by Eskom in Excel format on this page. I have used Homepower 1 non-municipal rates including VAT since that’s what I pay at my home. I have again included an 8% increase overlay as a guide.

    Since 2013 the Homepower tariffs have been split into two blocks. You pay the lower price on your usage up to 600 kWh/30 days or 20 kWh/day. If you use more, the overage is charged at the higher price. It is important to realise that if you are currently using more than the Block 1 cutoff, electricity savings will save you that full Block 2 tariff until you drop back below 600 kWh per 30 days. It is not correct to reason using your average cost when contemplating savings. Of course, if you are trying to calculate your total monthly bill, you will have to add the monthly connection fee as well, but I have chosen to focus on the marginal costs in this analysis.

    Simple comparison

    Now we are in a position to compare the energy cost from LPG with electricity. The following chart shows all the prices we have calculated so far. What is clearly visible here is that even in the best case for gas (using Coastal prices at the higher heating value), it never becomes cheaper than the best case for electricity (Homepower 1 block 1). There is some room for a more nuanced comparison when you enter Block 2, especially if you are paying Coastal prices. If you’re wondering about the conversion efficiency of electricity to heat, for applications where you are heating water with a submerged element, it is very near to 100 % efficient.
    It’s also worth remembering that I’ve been talking about “best case” conversions for gas. In real life applications it is very hard to extract the full HHV or even the full LLV.

    Cost ratios

    One way to simplify the analysis further is to compare ratios of costs instead of just costs, since these will stay constant for exponentially growing curves like the ones we’re seeing here. This also has the benefit that it removes the units from our calculations, so we don’t have to worry about whether we’re using kWh or MJ for energy. I will continue from here using Gauteng prices and the HHV for gas since I live in Gauteng and the HHV gives a good upper bound for gas. 
    We can see in the following graphic that the cost ratios have stayed relatively constant since about 2015. The observation that Block 1 is definitely cheaper than gas is repeated here, but now from the fact that the ratio is less than 1. If you’re in Block 2, the average ratio for the last 5 years is 1.18.

    Estimated efficiencies

    This all started with geysers, so that’s what I’ll analyse first. Electrical geysers feature submerged elements and almost all the electrical energy will be converted to heat. So the controlling factor will be the gas efficiency. To beat electricity, a gas geyser would have to be more than 85 % efficient, which from my research seems quite unlikely. If you are using a heat pump, with a coefficient of performance of 3 or more, you end up with a clear win in favour of electricity.
    For cooking, gas is not particularly efficient, with figures quoted between 40 % and 60 %. Anyone who has found their kitchen warming up due to their use of a gas hob can attest the energy doesn’t all go into the pot. Old school electrical hobs aren’t that great either, since the contact between the element and the pot can be poor and there are also long heating times to contend with. I use an induction hob, which is closer to 90 % efficient. So I guess gas doesn’t come out cheaper there either. I am well aware that many people simply prefer to cook on gas and that having a hob that works during load shedding is very useful. 

    Alternative explanations of savings

    So what is the explanation of the savings that people describe? I have thought of a few alternative explanations:
    1. There might be a psychological “two bucket effect” where the drastic savings on the electricity bill might obscure the extra cost of gas.
    2. The immediacy of many gas applications may result in lower use overall due to less time spent waiting for things to heat up (this is especially true for cooking).
    3. For space heating, the high power of gas heaters may mean that you have a large radiative heating effect resulting in immediate feeling of warmth while electrical heaters may need to heat a lot of air to get the same level of comfort.
    4. For the geyser application, you are keeping water hot, so there are continuous losses. If your geyser is poorly insulated, this can be a big deal. I looked at this technical report which reported about 2 kWh/ 24 h = 83 W of losses from several tested geysers, which I thought was negligible, about the same as an old incandescent light bulb. For comparison, heating 200 L of water from 25 °C to 65 °C uses about 10 kWh. So I guess it depends on the frequency and length of your showers. If you don’t need a lot of hot water, it’s also best to install a smaller geyser.
  • No free energy: why EROEI matters

    This is a follow-up post on the previous one about energy in SA. After writing it, or more accurately after writing many of the same words in a very long Facebook battle recently, a few links were posted that claimed that EROEI doesn’t matter.

    The Wikipedia article on EROEI gives a pretty good summary. In short, you use energy to collect energy in the future. It has been argued that EROI doesn’t matter when you have a source of energy as bountiful as the sun.  Unfortunately, you actually have to build things like solar panels or windmills to capture the energy coming from the sun and convert it into something that we can use.

    I wrote a quick simulation in Python that shows why it does matter,
    and would like to paste some of the prettier results here for posterity.  The scenario I analysed works as follows:

    Imagine we live in a world where we are using 1 energy unit every month, and we expect to double that usage over the next 100 years in a linear fasion (this is already a little ambitious, as recent energy demand growth has been closer to an exponential).  Further, imagine we have the ability right now to produce 1.2 units of energy every month (20% more than we use), but we want to phase out the dirty old technology linearly over a period of 15 years.  Graphically the situation looks like this, for the next 20 years.

    So, let’s say we see problems ahead and therefore we use some fraction of the surplus energy every month (say 20%) to build new solar panels which will supply clean energy in the future.  For the purposes of this simulation, let’s use a productive lifetime for these panels of 20 years.  The EROEI is the ratio of the energy produced by the panel over its total lifetime to the original energy cost of the panel.  The next figure shows the results of our slightly unnatural situation for values near the balance:

    I’ve shown three values for EROEI for our theoretical solar panels, chosen so that they either fail to satisfy our energy demand, just manage to do so or do so exponentially well.  This illustrates just how important it is to invest in the correct technology, even if it is renewable. In our example, any EROEI less than 10.3 will result in us running out of energy, with no way to build ourselves out of it.  There is no Energy Bank where we can borrow a lot of energy to build the new things we need – the world doesn’t work that way.  The closest we have at the moment is the energy stored as fossil fuels, but that is also not an infinite resource.

    Another way of looking at EROEI is that it determines what fraction of the total energy activity of our society is dedicated to building replacement energy devices. In fact, the calculation is very simple, this fraction just the inverse of the EROEI (1/EROEI).  So when EROEI is 2, half of the energy economy is dedicated to building more energy devices.

    I post the source code for the simulation here in the interest of transparency. Note that these are fictional numbers in fictional units, but the simulation illustrates a point: there is something like a too-low return when it comes to building the new energy capacity that we will need to ween ourselves off fossil fuels.

    from __future__ import division
    import matplotlib.pyplot as plt
    
    # Simulation parameters
    Nyears = 20
    Nmonths = 12*Nyears
    
    # Installed capacity
    def installed(i):
        """ Linear decline in installed capacity down to zero"""
        endt = 15*12
        beginE = 1.2
        if i > endt:
            return 0
        else:
            return (endt - i)*(beginE)/endt
    
    # Usage
    def usage(i):
        """ linear increase of 0.1 unit per year of 1 unit/month """
        return i*1/100/12 + 1
    
    # New energy stats
    life = 20*12
    buildfactor = 0.2
    
    # For plotting
    months = range(Nmonths)
    
    def simulate(EROEI):
    
        # Initial energy
        E = 0
    
        # remember what we have built
        builds = []
        Eovertime = []
        for i in months:
            # add installed capacity
            E += installed(i)
    
            # add energy from built capacity
            for (b, Ecost) in builds:
                if i - b < life:
                    E += Ecost*EROEI/life
    
            # subtract usage
            E -= usage(i)
    
            if E < 0:
                E = 0 # can't go into energy debt
            else:
                # spend a fixed fraction of reserves on building new capacity
                Ecost = buildfactor*E
                E -= Ecost
                builds.append((i, Ecost))
    
            # Save what we have after all that
            Eovertime.append(E)
    
        return Eovertime
    
    
    timeaxis = [i/12 for i in months]
    
    plt.plot(timeaxis, map(installed, months),
             timeaxis, map(usage, months))
    plt.xlabel('Years in future')
    plt.ylabel('Energy')
    plt.legend(['Old energy installed capacity', 'Usage'], 'best')
    plt.savefig('assumptions.png')
    plt.figure()
    
    ratios = [10.5, 10.305, 10.1]
    for EROEI in ratios:
        plt.plot(timeaxis, simulate(EROEI), linewidth=2)
    
    plt.ylim([0, 4])
    plt.axvline(15, color='black')
    plt.axhline(0, color='black')
    plt.xlabel('Years in future')
    plt.legend(ratios,  'best')
    plt.ylabel('Energy stored')
    plt.savefig('trajectories.png')
    plt.show()
    
  • A quick look at energy in South Africa

    I suppose I should stop worrying about people being wrong on the internet, but when you’re invigilating an exam, you start reading Facebook, and then you end up with a long debate about renewable energy.  It just came up.  I’ve decided to take some of the stuff I put up on Facebook and add it to the comments I’ve been collecting in this post about energy in South Africa.

    An article on IOL started it all, but this one is better. Both of the articles get very confused about the units – the IOL one talks about “GW per hour” and the Guardian one mentions electricity costing “23 cents per kW/h”.  The point is that Germany set a record of 22 GW of electricity being produced at some point on Saturday, 26 May 2012.

    Units

    So let’s clear up the energy unit problem first, with some examples.   We have to understand
    the difference between energy, measured in Joule in the SI system, and
    power, which is measured in Watt (Joule/second) in the SI system. Power
    is energy per time, or the rate at which energy is used. In more understandable terms, energy is to distance as power is to speed.

    Now let’s look at what the IOL article is saying: “22 gigawatts of
    electricity per hour”. This is the same as saying “I drove to Pretoria
    at 60 kilometers per hour per hour”. Note the extra “per hour” – it
    doesn’t make sense. The official they quote, and the Guardian gets it right and says that
    they were producing “22 GW” at their peak capacity. Remembering the
    speed analogy, this is like saying you hit 160 km/h on the highway on the way to Pretoria.
    Your average speed will typically be much less. For perspective the
    article also mentions that this is about a third to half of their
    demand, which puts their demand at between 44 GW and 66 GW.  The entire world’s electricity consumption is around 119 PWh/year or 13.6 TW.

    Energy from the sun

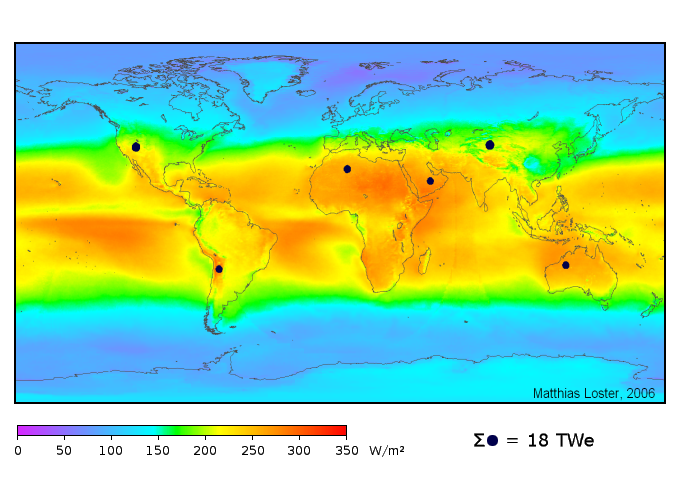
    Solar energy has a lot of potential.  Most people have seen the following picture showing how much energy the sun provides. Those small black dots are the area we would need to cover with 8% efficient photovoltaics (PV) to provide 50% more than the 2010 use of electricity. I recommend having a look at how good PV actually is over at Do the Math
    Most of the solar capacity in Germany is from PV power stations, while they also have very aggressive subsidies for Grid Tie PV. These subsidies are currently being reconsidered, and there is much debate over whether they were worth it.

    South Africa vs Germany

    South Africa is well-known as a sunny country – it is clear we are in a good place solar insolation-wise from the graph above, and we have more surface area with less people than Germany.  So why are the Germans supplying such a large fraction of their electricity demand with solar while we aren’t?  In fact, why are we planning to build more nuclear power stations?

    How much are we talking about?

    Eskom has a nice page showing the key facts about electricity production in South Africa. This page quotes their sales for 2011 as 218 120 GWh. This converts to about 25 GW (Google “218120 GWh per year in GW”). That is an “average speed” figure – they produce that much electricity over the whole year. The same website mentions the peak demand for 2011 was 34.807 GW.  Now, although the peak value supplied by solar in Germany is very high, the actual production of electricity over the entire year is quite a bit less.  The Wikipedia page on solar power in Germany lists solar as supplying 3.2 % of the electricity in Germany in 2011. That seems quite a bit less impressive, although the peak values show something of what is possible.  One should remember that that peak value cannot be maintained through a whole day. You can see the capacity factor is around 10%

    We have things they don’t (coal and uranium)

    Probably the best argument that I have come up with is shown in the following graph showing Energy imports as % of energy use.  Note that this is bigger than just electricity.

    It is clear that Germany does not have enough sources of energy inside their borders to supply their demand. South Africa does. Their investment into other sources of energy reduces their reliance on other countries. South Africa exported 67 Mt of hard coal in 2009 while Germany imported 38 Mt, our economy is largely constrained by the resources available to us. If Germany had more coal, I am pretty sure they would not have pushed nearly as hard to get rid of this import. By the way, the same source also lists Germany as one of the top importers of natural gas in 2009.

    They have things we don’t (money)

    Also notice this sentence in the IOL article: “German consumers pay about 4 billion euros ($5 billion) per year on top of their electricity bills for solar power”. SA just is not rich enough to afford the kind of rollout Germany has done. Their yearly expense for solar power is larger than our planned building expense for the nuclear power plants that will then produce power more cheaply.  The SA nuclear program seems to be about R800 billion over 20 years. That’s about 4 billion Euros per year for 9.6 GW (with 80% availability that becomes 7.68) – which is what Germany payed for 2 GW (18 TWh/year in GW)

    Why even consider coal if it’s bad for the environment?

    The allure of cheap energy is huge. Coal as a Energy Return on Energy Invested (EROEI) of over 100, nuclear in the 50s and solar closer to 10 (see table 2 of this analysis).  Tom Murphy has a much better analysis of the problems of low EROEI that I could hope to do called The Energy Trap.  Briefly, the problem is that it takes energy to build devices to make energy, even if the ultimate source of that energy is “Free”.  This means that we have to climb into debt somewhat to build new capacity when we don’t have the really huge payback we get from coal.

    Final words

    From what I can see at the moment, your best bet if you want to reduce your impact on the environment is to reduce your energy consumption through directly trying to use less energy. Walk more instead of driving, open up the blinds instead of turning on a light. Install some of the awesomely efficient new LED lights or CFLs.  These things will save energy and save you money with very little effort and very little discomfort.
    If you’re OK with a little discomfort in order to reduce your environmental impact, stop watching TV, use less electronics in general, plant a garden and eat from it rather than eating imported stuff from far away, sell your family’s second car. These will not cost you much in monetary terms, but will require a change in lifestyle.
    A solar water heater is probably a good investment.
    If you feel moved to do so, you can spend money on solar panels or wind turbines. This requires a large initial investment and is not quite yet at grid parity (the figures I’ve seen for Grid-tie PV systems is R1.6/kWh, while Eskom charges between R0.50/kWh and R1.4/kWh).
  • You cannot say my running caused my weight loss

    It’s been almost four years since I started actively controlling my weight.  I had gained a significant amount of weight during my Master’s studies, primarily due to the ease of having a Steers burger for lunch every day when you’re right across from Steers in your lab. I estimate that my peak weight was about 100 kg, but my first proper measurement is 95 km.  I am 1.87 m tall and these two stats put me in the “overweight” category, on the bad end of the histogram.

    So, I started calorie restriction, as documented in my previous post on data gathering.  I lost a lot of weight in a pretty short amount of time and have kept the weight off.  A little later the same year (2008) I also started running.  When I tell people I run, many nod sagely and say “ah – so that’s how you lost your weight”.  I have good data that belie this idea, and I have now taken the time to graph the stuff together.  Here is my weight (smoothed with an exponential moving average filter) and my weekly running distance.  I have been tracking my running with a GPS enabled device since the very first walks around the block.

     It is clear from this graph that the majority of my weight loss happened before I started running.  I feel that this is probably why I could run at all.  I cannot imagine running with a 20 kg weight strapped to my back now!  It is also pretty clear that there is no significant correlation between my running distance and my weight.  Put a different way, I control my weight by varying the amount I eat, not by varying the amount I run. I’ve recently started tracking the calories I eat again – hopefully I can produce a graph next year that shows that my food intake is my dominant handle on my weight.

  • China childbirth stats analysed

    I read this infographic today about China’s one-child policy. One of the things that jumped out at me is that China has more men than women in their population, and the infographic (at the bottom right) mentions that some feel the policy makes this worse, along with infanticide and preferential abortion. So, I wanted to know how big the effect of the policy is and I did some stats.

    The infographic explains the process as follows:

    • As it is traditionally enforced, couples are encouraged to have only one child
    • If that child is a girl, parents would be allowed to have a second child to hopefully bear a son
    • After the second child, the would be discouraged from having a second child.

    Now, assuming that this is exactly enforced as written, there are only three outcomes of parents having children (let’s assume the chance of a birth resulting in a boy is x and ignore things like multiple births etc):

    Children Boys Girls Probability
    1 1 0 x
    2 1 1 (1-x)x
    2 0 2 (1-x)(1-x)

    Now, we can calculate the expected number of children, assuming everyone wants children and follows this process, this is simply 1 child with probability x and 2 with probability (1-x), so expected value is 1x + 2(1-x)=2-x. x is typically near 0.5, and they say that the fertility is near 1.5. Success! But what about the expected ratio of boys to girls?

    Using the table above, multiplying the “boys” column by the “probability” column and sum ming, we end up with 1x – (1-x)x=2xx2=x(2-x) boys expected. For girls, it’s 1(1-x)x + 2(1-x)(1-x)=(2-x)(1-x). If x is 0.5, this ends up with 0.75 boys and 0.75 girls. That doesn’t explain what we observe in China… In terms of the ratio of boys to girls, we see that the (2-x) term is common to both expected values, so the ratio ends up being x/(1-x). But this is exactly the same ratio that we would expect if no birthing policy is in place, as every birth would produce x boys and (1-x) girls on average. So, either these assumptions don’t hold, or we need to look elsewhere for the discrepancy.