Tag: efficiency

  • A quick look at energy in South Africa

    I suppose I should stop worrying about people being wrong on the internet, but when you’re invigilating an exam, you start reading Facebook, and then you end up with a long debate about renewable energy.  It just came up.  I’ve decided to take some of the stuff I put up on Facebook and add it to the comments I’ve been collecting in this post about energy in South Africa.

    An article on IOL started it all, but this one is better. Both of the articles get very confused about the units – the IOL one talks about “GW per hour” and the Guardian one mentions electricity costing “23 cents per kW/h”.  The point is that Germany set a record of 22 GW of electricity being produced at some point on Saturday, 26 May 2012.

    Units

    So let’s clear up the energy unit problem first, with some examples.   We have to understand
    the difference between energy, measured in Joule in the SI system, and
    power, which is measured in Watt (Joule/second) in the SI system. Power
    is energy per time, or the rate at which energy is used. In more understandable terms, energy is to distance as power is to speed.

    Now let’s look at what the IOL article is saying: “22 gigawatts of
    electricity per hour”. This is the same as saying “I drove to Pretoria
    at 60 kilometers per hour per hour”. Note the extra “per hour” – it
    doesn’t make sense. The official they quote, and the Guardian gets it right and says that
    they were producing “22 GW” at their peak capacity. Remembering the
    speed analogy, this is like saying you hit 160 km/h on the highway on the way to Pretoria.
    Your average speed will typically be much less. For perspective the
    article also mentions that this is about a third to half of their
    demand, which puts their demand at between 44 GW and 66 GW.  The entire world’s electricity consumption is around 119 PWh/year or 13.6 TW.

    Energy from the sun
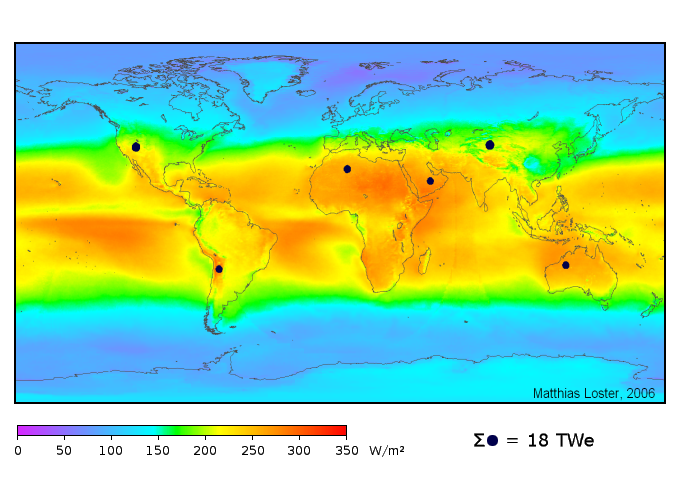
    Solar energy has a lot of potential.  Most people have seen the following picture showing how much energy the sun provides. Those small black dots are the area we would need to cover with 8% efficient photovoltaics (PV) to provide 50% more than the 2010 use of electricity. I recommend having a look at how good PV actually is over at Do the Math
    Most of the solar capacity in Germany is from PV power stations, while they also have very aggressive subsidies for Grid Tie PV. These subsidies are currently being reconsidered, and there is much debate over whether they were worth it.

    South Africa vs Germany

    South Africa is well-known as a sunny country – it is clear we are in a good place solar insolation-wise from the graph above, and we have more surface area with less people than Germany.  So why are the Germans supplying such a large fraction of their electricity demand with solar while we aren’t?  In fact, why are we planning to build more nuclear power stations?

    How much are we talking about?

    Eskom has a nice page showing the key facts about electricity production in South Africa. This page quotes their sales for 2011 as 218 120 GWh. This converts to about 25 GW (Google “218120 GWh per year in GW”). That is an “average speed” figure – they produce that much electricity over the whole year. The same website mentions the peak demand for 2011 was 34.807 GW.  Now, although the peak value supplied by solar in Germany is very high, the actual production of electricity over the entire year is quite a bit less.  The Wikipedia page on solar power in Germany lists solar as supplying 3.2 % of the electricity in Germany in 2011. That seems quite a bit less impressive, although the peak values show something of what is possible.  One should remember that that peak value cannot be maintained through a whole day. You can see the capacity factor is around 10%

    We have things they don’t (coal and uranium)

    Probably the best argument that I have come up with is shown in the following graph showing Energy imports as % of energy use.  Note that this is bigger than just electricity.

    It is clear that Germany does not have enough sources of energy inside their borders to supply their demand. South Africa does. Their investment into other sources of energy reduces their reliance on other countries. South Africa exported 67 Mt of hard coal in 2009 while Germany imported 38 Mt, our economy is largely constrained by the resources available to us. If Germany had more coal, I am pretty sure they would not have pushed nearly as hard to get rid of this import. By the way, the same source also lists Germany as one of the top importers of natural gas in 2009.

    They have things we don’t (money)

    Also notice this sentence in the IOL article: “German consumers pay about 4 billion euros ($5 billion) per year on top of their electricity bills for solar power”. SA just is not rich enough to afford the kind of rollout Germany has done. Their yearly expense for solar power is larger than our planned building expense for the nuclear power plants that will then produce power more cheaply.  The SA nuclear program seems to be about R800 billion over 20 years. That’s about 4 billion Euros per year for 9.6 GW (with 80% availability that becomes 7.68) – which is what Germany payed for 2 GW (18 TWh/year in GW)

    Why even consider coal if it’s bad for the environment?

    The allure of cheap energy is huge. Coal as a Energy Return on Energy Invested (EROEI) of over 100, nuclear in the 50s and solar closer to 10 (see table 2 of this analysis).  Tom Murphy has a much better analysis of the problems of low EROEI that I could hope to do called The Energy Trap.  Briefly, the problem is that it takes energy to build devices to make energy, even if the ultimate source of that energy is “Free”.  This means that we have to climb into debt somewhat to build new capacity when we don’t have the really huge payback we get from coal.

    Final words

    From what I can see at the moment, your best bet if you want to reduce your impact on the environment is to reduce your energy consumption through directly trying to use less energy. Walk more instead of driving, open up the blinds instead of turning on a light. Install some of the awesomely efficient new LED lights or CFLs.  These things will save energy and save you money with very little effort and very little discomfort.
    If you’re OK with a little discomfort in order to reduce your environmental impact, stop watching TV, use less electronics in general, plant a garden and eat from it rather than eating imported stuff from far away, sell your family’s second car. These will not cost you much in monetary terms, but will require a change in lifestyle.
    A solar water heater is probably a good investment.
    If you feel moved to do so, you can spend money on solar panels or wind turbines. This requires a large initial investment and is not quite yet at grid parity (the figures I’ve seen for Grid-tie PV systems is R1.6/kWh, while Eskom charges between R0.50/kWh and R1.4/kWh).
  • Lecturer rant reprise

    My post yesterday prompted many comments. This post attempts to address some of them.

    I got a couple of people expressing the idea that my experiences with suboptimal systems are not unique to my institution. I appreciate your comments, especially those mentioning specific institutions, as they give a bit of insight into the scale of the problem. I find widespread problems that would be (relatively) simple to solve in a (relatively) general way incredibly irksome. I feel great desire to solve these problems and distribute the solutions to everyone. The way I feel is quite well described by the hacker ethic. I aim to do meaningful work, but many of the things I am forced to do at the university are menial work. It gives me little consolation that others are doing the same things. In fact, it makes it worse.
    My boss chided me for putting the post online for everyone to see. His concern was for airing dirty laundry in public. I took the university’s name out of the post but I stand by what was said and I don’t think much is going to happen due to that rant one way or another, save perhaps serving as an aide memoire for the marking system ideas and a nucleation point for further discussion about it. The whole wikileaks furore was also being discussed copiously online at the time and I was struck by the urge for secrecy. I understand the need for privacy and feel the urge to confide in particular people myself, but I don’t feel quite the same way about organisations. I tend to feel they have a responsibility to be transparent. What is wrong with the idea that by talking openly about problems, you increase the likelihood of them being solved? Especially if many places are having the same problems?
    Later that day I had a bit of back-and-forth on Twitter with a mate who worked in the lab with me several years ago. He asked what I had done about the problems and suggested that I develop a prototype of a system to show to admin. His posts hit a nerve, because this is exactly the attitude that I have had up to now (don’t complain – just fix it). In the years I have been at the university I have developed the following tools that led out from me suggesting that things could be done better (I list my estimated cumulative time investment into these systems and the number of years they have been in development in brackets):
    • A static web page generator that we used to generate our departmental webpage for a couple of years before the new CMS was rolled out (100 hours, 4 years)
    • A system that uses the above along with a Google Docs spreadsheet to collect information about the department’s publications and generates a cross-linked static website suitable for burning to CD (50 hours, 3 years)
    • A project allocation system that uses GLPK to assign projects to students for our fourth-year project activity based on their preferences (150 hours, 3 years)
    • Scripts for typesetting the timetables for the school of engineering based on a flat format spreadsheet generated from syllabus. (250 hours, 4 years)
    • VBA code for use in Excel to calculate student number checksums and several shared calculations, including the supp calculation I mentioned in the previous post (10 hours, 2 years).
    • Roll-out of a departmental Wiki to capture information about these and other projects along with other documentation (50 hours 3 years)
    This list is not meant to sing my praises, but I suppose it serves to establish that I do not simply moan about things – I generally just say “that can be done better” and then move to do things better. The problem with this attitude is that these things are way outside even the most liberal reading of my job description, which means that all the time I spent on these projects is time that I could have (should have?) spent on my students, or developing better lectures or my PhD or any of the things that are actually expected of me.
    I completely understand why no-one is doing these things: because it is no-one’s job. Now, I get a bit annoyed at the “fix it yourself” attitude because I encounter it most often when it has anything to do with computers. I am a relatively capable programmer, and often when I complain that I can’t find a particular tool or about how a particular tool works I get this glib answer that complaining doesn’t solve anything and I should do something about it myself or shut up.
    Imagine a scenario: I post a tweet complaining that water is leaking from the ceiling of my office onto my keyboard. I decry the poor maintenance policies that led to the leak occurring and point out that a system should be in place which allows me to report such incidents and have them resolved in a timeous fashion. Would it be reasonable to ask me to develop a maintenance schedule for campus and perhaps implement a call-center? I think not, because such activities clearly belong with facilities management.
    I can think of endless cases where I lack the skills or the time to fix things that bother me. I have already put in a lot of time developing half-baked solutions to problems that could be solved far better by people who are actually trained in this work. I am not a programmer, I am not a systems analyst.
    Let’s say I want to build a house. I think it is reasonable to approach an architect with a functional spec (I want a nice kitchen, I want the house to be cool, I like this kind of design) and expect him to develop a detailed design rather than drawing up plans for the house myself. He is bound to do a much better job because this is what he is trained to do. I think it is similarly reasonable to point out the gaps in the admin system and expect them to either streamline the system themselves or at least bring in someone who can.
  • Lecturer rant: there should be a system for marks

    Even after six years at the university I am often amazed at how stupid we are.

    I use “we” there because I am part of faculty. I am amazed because of these stupid things (and these are just the ones I know of):

    Yearbooks

    The university yearbooks are written and maintained by hand. Yep, if you clicked on some of those links and saw lists of repetitive seemingly machine-generated content, you may infer that this is all on a database somewhere and simply sucked in to this document by some reporting system. You would be wrong. There are people in each department tasked with maintaining the system. Changes to the document are posed in the form of a manually generated diff and applied by humans. This means there is no automated consistency checking and no way of generating the dependency tree of a particular subject to answer a question like “I have failed GFU 320 – does this cost me a year?” because the dependencies are simply listed in the document. I have written scripts that scrape the PDFs for useful information like the number of periods allocated etc to check that they are consistent with the timetable (see the next point) and generate graphs like the one below that show the dependencies of our course. Why is there not an automatically generated graph like this with clickable links into the subject descriptions on the UP website? The graph is generated using Graphviz

    Timetables

    There is no single, up-to-date timetable for the university as a whole. Once a year the timetable book gets generated from a program called Syllabus Plus. After this point, all the advanced features of Syllabus, including distributed access by multiple people, custom web-based timetable views etc are ignored and the Word file containing the manually reformatted timetable information sorted by subject code is sent to each department. Each member of faculty then has to traverse this document searching for their subject and draw up a timetable in the traditional two-dimensional grid form themselves. This is a huge waste of effort! I have written scripts that read a dump prepared from Syllabus by our helpful IT staff in an Excel file that changes subtly each year even though I have given a detailed spec of the format I require and prepares timetables for the school of engineering.

    Unfortunately, this is not the end, because the venue bookings are handled on a totally different system which does not write back to Syllabus. This means that at any given moment it is literally impossible to reconstruct the exact timetable as it stands without talking to every lecturer involved, as the ad-hoc changes are only relayed to them and not recorded centrally beyond the subject name (not the group or other information you may need to generate the timetable). The whole situation is silly and costs everyone involved hours of their time as they sift through the book trying to verify that the information is correct. What makes it worse is that several other universities are allowing staff access to the syllabus plus system while we are using what boils down to one step above manual scheduling.

    Student marks

    Student marks are calculated by each lecturer using home-rolled spreadsheets that are almost guaranteed to have an error in somewhere. The rules to determine for instance if a student qualifies for a supp are subtle and often incorrectly implimented. To give you an idea, here is the logic for if a student qualifies for a supp in the school of engineering from the 2010 yearbook:

    In the School of Engineering a supplementary examination is only granted in instances where:

    1. A final mark of between 45% and 49% was achieved;
    2. A final mark of between 40% and 44% was achieved and where the candidate also achieved either a semester mark or an examination mark of 50% or higher;
    3. A pass mark has been obtained, but the required subminimum in the examination section of the module or divisions thereof has not been obtained.
    4. A final mark of between 40% and 49% has been obtained in first-year modules on 100 level.
    I have made a graph showing the regions for a 50% semester mark exam split:

    Is it not glaringly obvious that this should at least be coded up in a reusable spreadsheet function that can be distributed to everyone? Of course, that’s just a sticking-plaster, because the system is broken in more subtle ways.
    At the beginning of each course, an automatically-generated class list is sent to you by admin. It used to be a CSV file, now it is an Excel file (already my scripting has taken a knock right there). You then calculate marks in any way you want and send the marks back. Unfortunately they now send you a revised class list which does not have the same students in the same order as the previous ones. So what could have been a simple copy-and-paste now either becomes tedious lookup calculations or even more tedious manual lining up of the data. I think it is entirely obvious that we need things like the following ideas:
    • Accelerated marking system you scan in the memo and the papers, define active regions on the memo and mark directly into the system. The papers have a barcode sticker from a pile you issue the students at the beginning of each year, so your (lecturer) workflow involves going into the system and clicking through the memo for each paper. Totally transparent to the student and externals, a lot faster than carting around tons of papers and shuffling through them.
    • Grade calculation based on a tree structure with calculation nodes most all grade calculation can be seen as a tree-like aggregation of primary grades. Final mark is weighted average of semester and exam, each paper is sum of questions, which is sum of subquestions etc. You need a builder and navigator, with colour highlighting and live stats to answer questions like ‘why is this guy’s semester mark so low’ or ‘what will my class average look like if I adjust my semester mark’.
    • Audit trails all changes should be historied (BIG fail with spreadsheet-based systems). If an adjustment is made, this should be noted for this student so that one can track the total ‘free marks’ a particular student has received. This can also be used in
    • Automatic edge case detection: Students that are ‘close’ to particular boundaries like distinctions or failing or supps should be identified by the system and automatic adjustments should be suggested. This would of course be historied so that you can review how much action has been taken. With a proper system, this would include all the student’s subjects, so that the system would warn you if a student (for instance) only needs your subject to pass his whole course and has not received a lot of free mark. I have even thought a good system could be that you start your course with 0.5 percent per test (so 0.5 for semester mark, 0.5 for exam and 0.5 for final mark), so 1.5 per course. This is the adjustment we allow today anyway, as we round each of those marks. Lecturers can use some of these marks for adjustments. The system could even find optimal distribution of the free marks to maximize the chance that the student succeeds in the course. I mean, we’re only probably repeatable within about 2% to 5% on marks anyway.
    • Aggregated statistics lecturers should be able to see the distributions of the other courses this group has, and be warned about strange anomalies like an otherwise good student scoring really low or an average student doing particularly well.
    The thing that amazes me most is that we have all this student manpower doing projects to design websites and database systems and intelligent algorithms for fault-finding and inference, but we’re not using any of it on our own systems! I am sure that the development of a system with some of the features above would not be beyond our student body. A part of the problem is that no-one sees development of such systems as part of their job. If one person were to try to develop such a system they would end up wasting a lot of their own time, as the total loss of time is distributed among so many people. This means there should be a higher-up decision about introducing more efficiency in the system rather than a lone developer working on it. Unfortunately, the small losses aren’t accounted for in an actionable way and things keep going like they’re going. Perhaps I will should send a link to this blog post to my head of department…